Why deep neural networks conquered all...except tabular data

Deep Dive
Before the deep learning revolution, machine learning research was fragmented. Using a hodgepodge of techniques, researchers in various fields created bespoke architectures to fit their needs.
Now, of course, things have changed. Deep neural networks (DNNs) dominate machine learning. From image classification to natural language processing, protein folding and climate simulations, neural radiance fields, and diffusion models, it's DNNs all the way down. This dominance speaks to the incredible generality of DNNs.
And yet, one unconquered territory: tabular data. From hospitals to businesses, organizations produce terabytes of tables in relational databases, CSV files, and Excel sheets. In that niche, decision trees reign supreme. Why is that? Will DNNs come to dominate tabular data too?
How decision trees and deep learning work on tables
Let's start by understanding how the two classes of models train and infer on tabular data. If you're already familiar, skip to the next section.
Decision trees

Given an input row, the tree branches to one of two possible paths depending on some criterion. For example, a diabetes risk assessment model could split based on a patient's blood glucose level. Branches could also be made from categorical columns, such as sex. Then, at the leaf of the tree, when there are no more branches left to take, a prediction is made.
The state-of-the-art decision tree methods are called Gradient-Boosted Decision Trees, or GBDTs. To train a GBDT, we start by training one tree. Then, we add another tree in a way that minimizes the remaining loss. By repeating this process, we end up with a collection of decision trees. To make a prediction given some data point, we go down each tree and collect all of the predictions. Then, we aggregate the predictions. One way is to take the majority prediction for classification and the mean of the predictions for regression.
GBDTs like XGBoost, CatBoost, and LightGBM are not only fast to train compared to DNNs but also perform strongly on tabular data.
Tabular deep learning
DNNs, on the other hand, require the input to be a vector. The simplest classical method is to normalize the numerical columns and one-hot encode categorical columns.
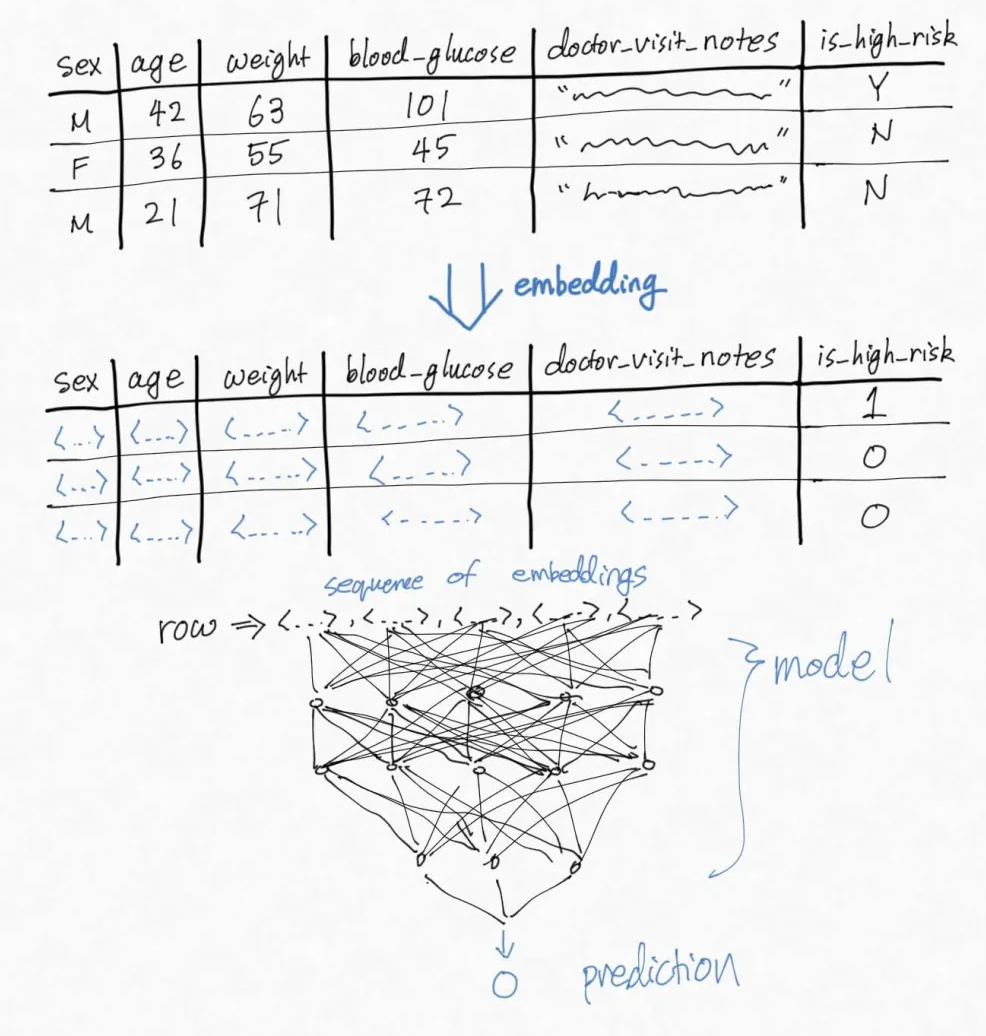
The more modern method is to turn each cell into an embedding, a small vector that represents the cell's meaning. By turning categorical columns into embeddings, for example, a model can better capture the complex interdependencies between the possible values. Even numeric columns are sometimes turned into embeddings. Embeddings also allow us to handle tables that contain multimodal data, such as freeform text, images, or audio.
Then, each row in the table becomes a collection of vectors. We could concatenate them into one long vector and feed it into a model, which is sometimes done for multi-layer perceptrons. Some other architectures like transformers are specialized at handling streams of embeddings.
Once the input is passed into the DNN, the rest of the model is standard deep learning, which I will not elaborate on here.
Are decision trees better than deep learning?
The short answer is: Not always, but often.
The long answer is that GBDTs are slightly better than DNNs more often than not, but the performance gap is narrow. As such, some papers argue one way or another. Still, two of the more comprehensive survey papers agree that GBDTs, on average, slightly outperform DNNs.1,2
This is not to say that DNNs are never the right tool for the job. There are a sizable number of datasets where the rankings are reversed. If the compute and time overhead of DNNs is not an issue, then it's worth trying out at least one GBDT and one DNN. The choice of a specific GBDT or DNN architecture seems to have a marginal impact.
When and why are GBDTs better than DNNs?

Non-smoothness
Theoretically, DNNs can approximate any smooth function, given enough data. On the other hand, decision trees are better at approximating piecewise functions that have sudden jumps in values. Due to the discrete boundaries between columns and the prevalence of categorical data in tables, the underlying distribution is likely to be non-smooth. Hence, the inductive bias of decision trees is better suited for tabular learning.1
Feature bloat
Tabular data can often be very wide, spanning thousands of columns. There are several reasons why. Perhaps the data collection method is sparse, like a doctor prescribing only a small subset of available blood tests to each patient. The features could also be the result of a large join operation. Perhaps additional features were added by the database administrator to capture different aspects of existing columns. For example, the same location data can be representing using longitude and latitude or with a zip code.
If a table is very wide, then only a few columns might be relevant for the final prediction. DNNs struggle with such tables. If some input dimensions are essentially random noise, a DNN must learn a function that is flat in those directions, which doesn't always materialize. On the other hand, since decision trees hone in on the most informative column in each split, they can ignore useless columns.1
Non-regular distributions
DNNs also struggle to perform well if the distribution within a column is irregular due to a long tail of numeric values or the presence of rare values in categorical columns. GBDTs can deal with such outliers more robustly by ensuring that a small subset of trees or branches specializes in dealing with outlier data.1
Dataset size
The relationship between dataset size and the relative performance of decision trees vs DNNs is not clear. One survey shows that decision trees perform better in large-scale data with tens of thousands of rows. Another suggests that the inverse is true, with decision trees out-performing DNNs by the largest margin in medium-sized data with thousands of rows.1,2
Rotational non-invariance
In tabular data, each column (or dimension) has a different meaning. In medical datasets, age and weight have completely different interpretations. On the other hand, for image data, each dimension of the input vector has the same meaning: they are pixels, merely at different locations.
This characteristic of tables is called rotational non-invariance. One way to think about it is that swapping values in different columns causes the data to become meaningless. On the other hand, a cat is a cat, even if the photograph was taken upside-down.
Some DNNs, especially ResNets, are specialized at learning rotationally invariant data, such as images. Such model architectures might struggle on tables.1
How can we improve DNN performance on tables?
As aforementioned, certain properties of the table at hand could nudge you toward choosing the right model architecture. But that is not the only tool in an engineer's toolbox. A recent study found that feature engineering accounts for the majority of variance in performance differences, regardless of model architecture.3
What feature engineering methods are useful? The authors list some common techniques:
- Explicitly encode the frequency of each value in a categorical column. This could be useful if the popularity of the categorical value is itself an important piece of information.
- Feature selection, especially if some features are not informative.
- Creating a new column out of a combination of several columns. Such categorical interactions help the model learn the interactions between related columns.
- GroupBy interactions. Essentially, given some numeric column A and some categorical column B, we create a new column C based on the query SUM/MIN/MAX/AVG A GROUP BY B.
For now, these feature engineering techniques have to be employed by an engineer based on heuristics or trial-and-error. However, new tabular DNN architectures are getting better at doing these feature engineering tasks on their own. (A topic for a future deep dive, perhaps?)
Concluding thoughts
Empirically studying the behavior of machine learning models is quite difficult, due to their black-box nature and the often unpredictable relationship between hyper-parameters and performance. I am not convinced that we have enough data to back up all claims in the existing studies. However, they provide decent hypothesis and heursitics to guide engineering.
Paper Highlight
PDX: A Data Layout for Vector Similarity Search4

Vector similarity search forms the foundation of recommendation systems and semantic search. Most vector databases store vectors in a row-wise layout, ensuring that similar vectors belong to the same page to maximize locality. PDX takes a different approach: it is a columnar data layout specialized for SIMD processing. Given the order-of-magnitude speedup that relational databases can get from switching to columnar layout with SIMD, this work might signal an analogous shift for vector databases.
SePer: Measure Retrieval Utility Through the Lens of Semantic Perplexity Reduction5

Retrieval augmented generation (RAG) allows LLMs to answer a user's prompt with knowledge stored in a large database. It does so by finding relevant documents to use as references. Choosing the right document, however, is not easy. The simplest way to measure the effectiveness of a retrieval strategy is to measure whether the retrieval improved the LLM's answer. However, this measure is quite coarse. Instead, the authors propose peering into how the model's confidence for possible answers changes before and after retrieval.
Personal Notes
I previously wrote about how I was able to read more books by co-opting the habit of pulling my phone out when bored. I'd like to add one new trick to the repertoire: audiobooks! All New York residents can get a New York Public Library (NYPL) card, and get access to their large repository of audiobooks that can be borrowed on-demand on the Libby app. I've recently read The Rise and Reign of Mammals and The Ends of the World mostly while doing housework. (And yes, audiobooks count as reading.)
References
- Grinsztajn et al. Why do tree-based models still outperform deep learning on typical tabular data? NeurIPS 2022.
- McElfresh et al. When Do Neural Nets Outperform Boosted Trees on
Tabular Data? NeurIPS 2023. - Tschalzev et al. A Data-Centric Perspective on Evaluating Machine Learning Models for Tabular Data. NeurIPS 2024.
- Kuffo et al. PDX: A Data Layout for Vector Similarity Search. arXiv 2025.
- Dai et al. SePer: Measure Retrieval Utility Through The Lens Of Semantic Perplexity Reduction. ICLR 2025.